TigerGraph Tutorial
Overview
TigerGraph is a popular graph database. Information of the offering can be found at
https://tigergraph.com/. There are several sample datasets which can be easily loaded into a workspace. In this tutorial the one being covered uses the Customer360 dataset. The Qarbine Administrator must have configured a data service to this dataset to perform the walk through.
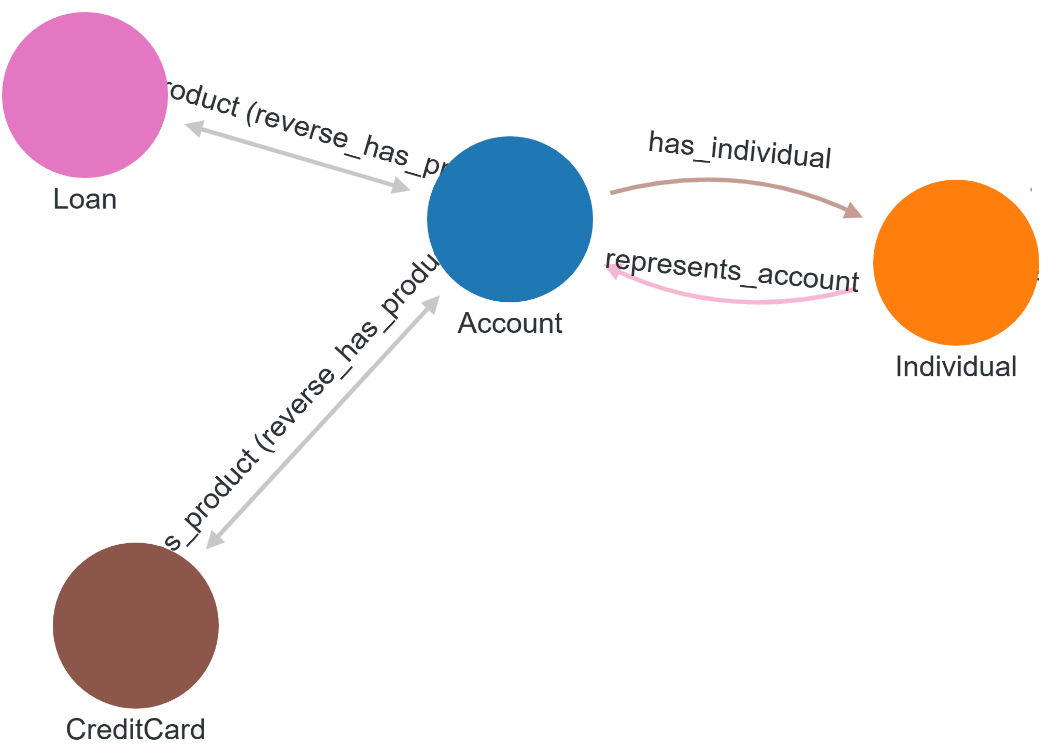
The TigerGraph Design Schema tool can be used to view the graph relationships.
The overall diagram is shown below.

For this tutorial an analysis is going to present accounts (blue) along with their related individuals (orange) and financial products such as loans (pink) and credit cards (brown).
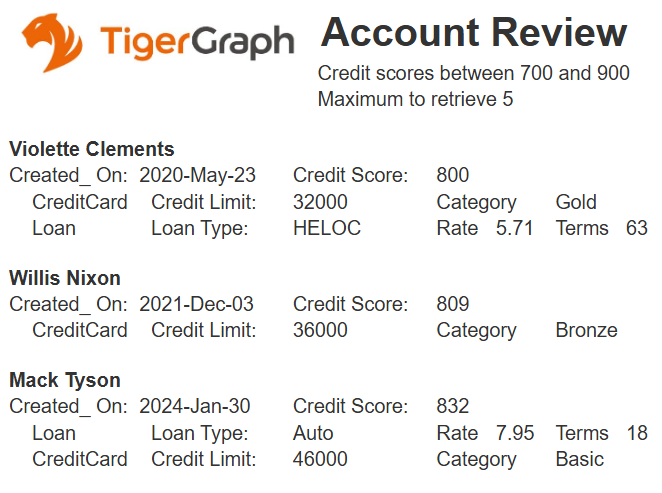
Sample output is shown below.
Defining a Data Source
Overview
A Data Source is a Qarbine component responsible for retrieving data from somewhere. At a high level it has a name, a description and some arbitrary query string which when sent to the associated Qarbine Data Service endpoint returns some data. The overall execution flow for an analysis, including the optional prompt component, is shown below.
A single data source can be referenced by name from multiple Qarbine template components. This enables a single point of change when perhaps, an index is added, or some other query tweak is necessary. The alternative is to attempt to find all templates impacted by a schema or index change for example. This component reusability is especially beneficial when team members have varying roles and skills.
Customer 360 Schema Properties
Open a Data Source Designer and choose the data service and database.

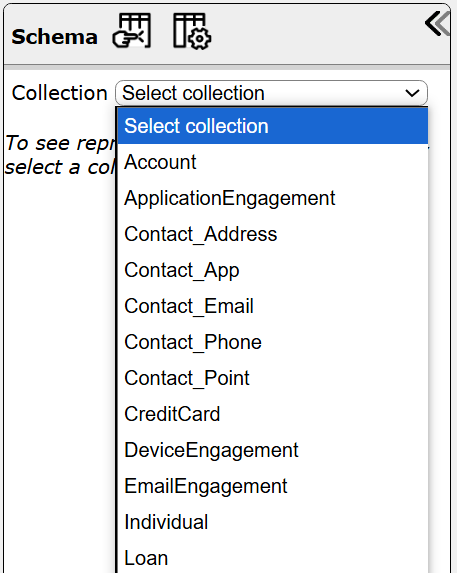
To see what vertex types are in the graph choose the drop down shown below.
An account has the following properties
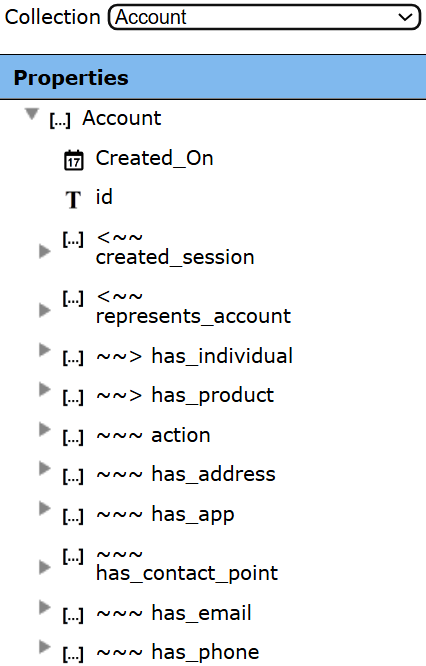
The top portion shows the attributes of the vertex type. It is followed by the edge relationships.
| Arrow | Description |
|---|---|
| ˜˜> XXX | This type points to type XXX. An Account has_product Y. |
| <˜˜ XXX | This type is pointed to by type XXX. An Individual represents_account XXX. |
| <˜> XXX | This type refers to itself. |
| ˜˜˜ XXX | This type can point to or be pointed to by type XXX. |
Below are the properties for the Individual vertex type.
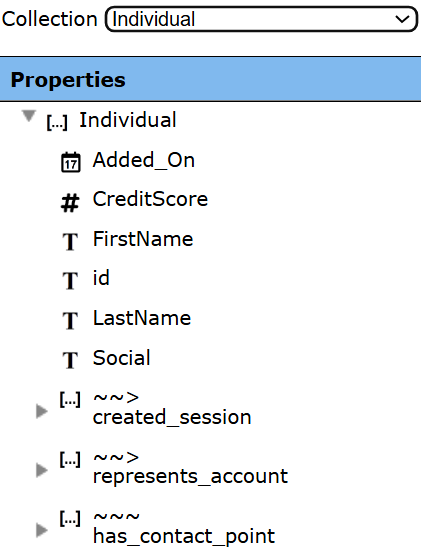
As a starting query, retrieve a few Individuals using the query specification below.
SELECT i.id, i.FirstName, i.LastName, i.CreditScore
into Result FROM Individual:i
LIMIT 3;
PRINT Result;
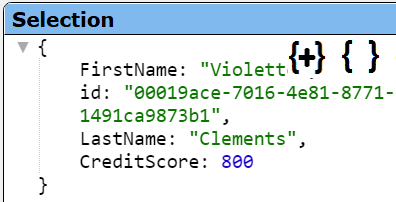
Sample results are shown below.

Clicking on the first row shows its details to the right.
Some criteria can be added as shown below.
SELECT i.id, i.FirstName, i.LastName, i.CreditScore
into Result FROM Individual:i
WHERE i.CreditScore between 750 and 800
LIMIT 3;
PRINT Result;
The Account and Product relationship data (Loans and CreditCards) can be pulled together with the following.
SELECT a.Created_On, i.id, i.FirstName, i.LastName, i.CreditScore,
p.type as product_type, p.id as product_id into Result
FROM Account:a -(has_individual>:ii)- Individual:i,
   Account:a -(has_product>:pp)- (CreditCard|Loan):p
WHERE i.CreditScore between 750 and 800
order by i.id
limit 3;
PRINT Result;
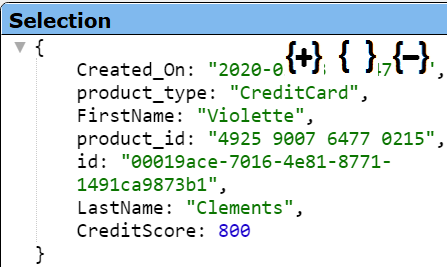
Sample results are shown below.

A selection’s details are shown below.
Save this Data Source by clicking
Provide further details and indicate a catalog location.
This example can be found at “example/TigerGraph/Customer360 - Accounts with criteria”.
Managing Answer Set Size
The default maximum number of rows starts off at 25 for a new data source. This is useful to evolve a query from a concept to one that you have verified returns the desired answer set. As noted, any native way of limiting an answer set size is the preferred approach. This setting is in the component dialog as shown below and also accessible by clicking the ‘Gear’ icon.
Once you are done drafting you can adjust this parameter. A “0” indicates there is no maximum. A number greater than 0 indicates to limit the final answer set size to that number of rows. This answer set truncation comes after any native query limit. So, if the answer set from the data endpoint is quite large, that content has to be returned to the Qarbine host. It then may truncate the number of rows. It is best to truncate at the query level (i.e., use a limit) to reduce the content sent from the data endpoint to the Qarbine host in the first place.
Adjusting the Maximum Rows
Recall the default maximum rows at the component level is 25. When you are satisfied with your query you can change that setting by clicking.
Adjust the setting to “0” indicating no Qarbine answer set truncation.
Click
Defining an Analysis Template
Overview
A template defines how to process the data being retrieved from Data Source queries and other data expressions. It also defines formulas, formatting options, and other analysis and presentation options. The overall execution flow for an analysis, including the optional prompt component, is shown below
Customer 360 Analysis
Below is an analysis result using a data source accessing customer 360 data. We start by using the data source with its hard-coded credit criteria.
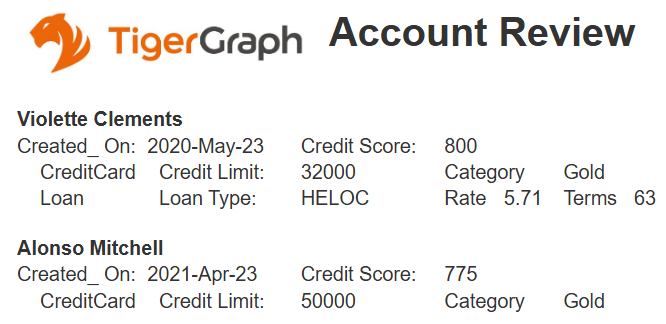
Later we then make adjustments for a more flexible analysis by using a Qarbine Prompt component for credit score range and other criteria.
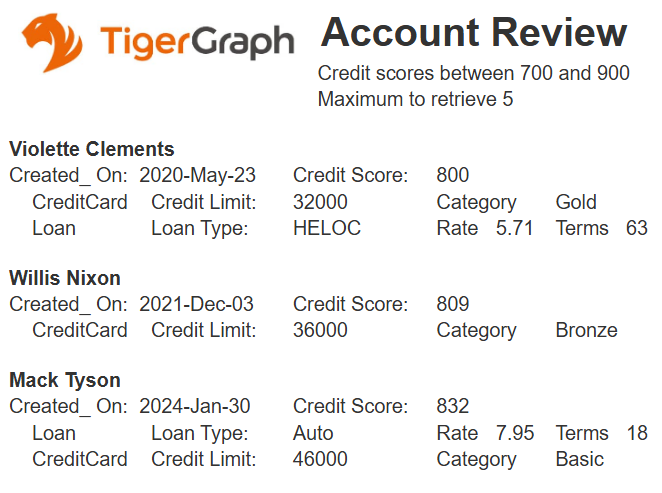
Initial Template
The overall template layout is shown below.
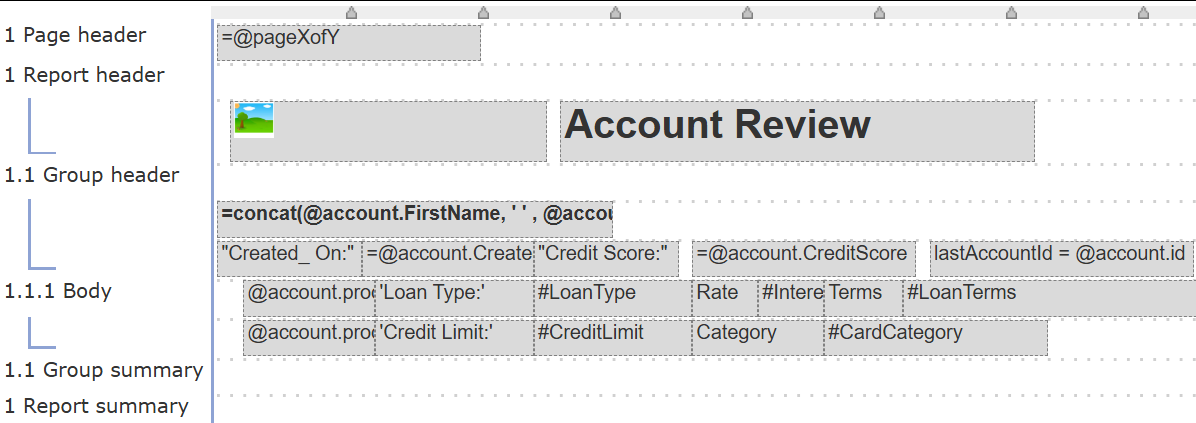
From a starting template set the properties by clicking.
The properties dialog is shown.

Enter a name.
To reference the just created data source click on the highlighted icon.

Select the first data source.
Click
The template properties dialog is updated.

Set a main data element variable name as shown below.
To close the dialog click
The right side of the Template Designer now shows information about the main data component.
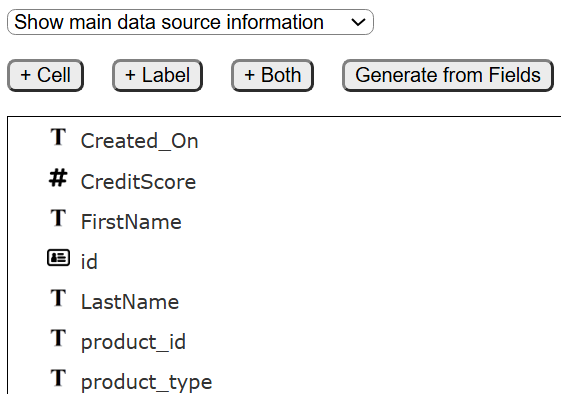
This provides very useful context information and buttons to quickly add cells to the template.
Shown below is sample data retrieved with a row for each Account’s product.

Our analysis is going to iterate through these rows and first display the Individual first and last names. Below that are going to be the product details. It is important to realize that a Loan product has different properties than a CreditCard product. Qarbine provides variety of conditional formatting options at the cel, line, and group level. In this case we are going to use line level conditions to display properties based on the product_type value (Loan or CreditCard).
The group header cells are shown below.

The name information is created using the concatenation function within the formula
This formula obtains the FirstName and LastName fields from the main data variable “account”.
The last group header line contains the following cells.
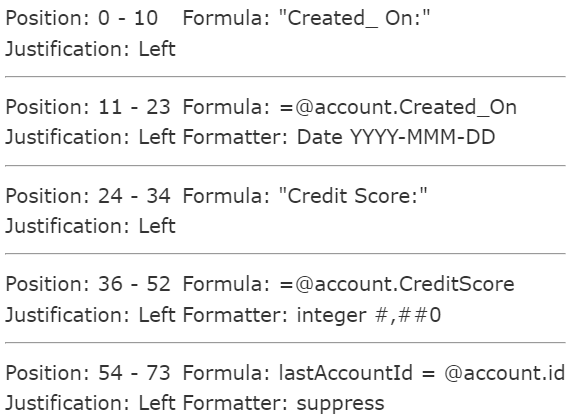
The group header and body are processed for each row in the answer set. Recall there is a row for each product of an individual. We do not want to repeat the individual information in the output for products 2 and onward. To suppress this output we track the lastAccountId via
lastAccountId = @account.id
and then reference it in the group header lines’ processing conditions
The first body line is for Loan products and has the cells.
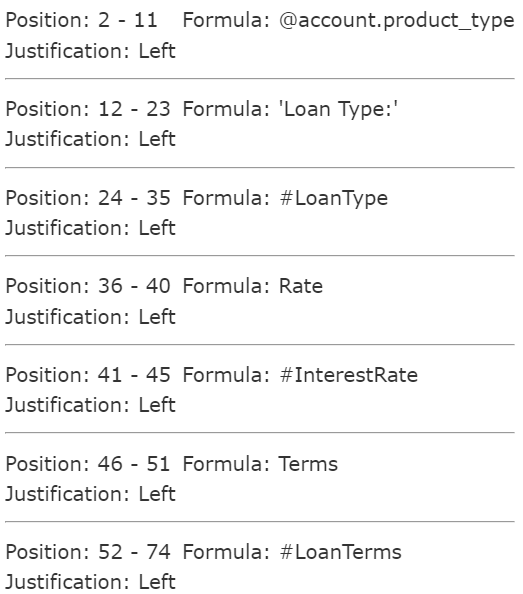
It has the following process condition.
The second body line is for CreditCard products and has the cells.
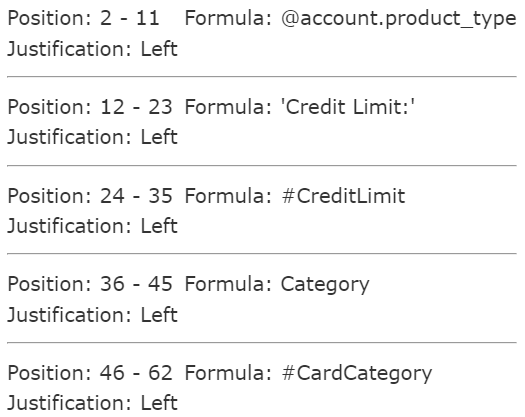
It has the following process condition.
The report header line has the following cells.

The image was added by clicking a grid position in the template.
Choosing the following on the right side.
Choosing
Clicking
Enter the formula
Save this Template by clicking
Provide further details and indicate a catalog location.
This example can be found at “example/TigerGraph/Customer360 - Account review with criteria”.
Runtime Prompt Integration
Overview
Qarbine prompts provide a way to obtain runtime values and variables for data source and template execution. To avoid hardcoding, prompts can use macro formulas to run queries which populate list widgets. Prompts are defined in a no code manner using the Prompt Designer. Shown below is the execution flow when there is a Prompt component.
The Prompt Designer supports a large variety of input widgets including entry fields, check boxes, radio button groups, sliders, and file input.
Sample Criteria Prompt
Below is a prompt to obtain criteria for the template above.
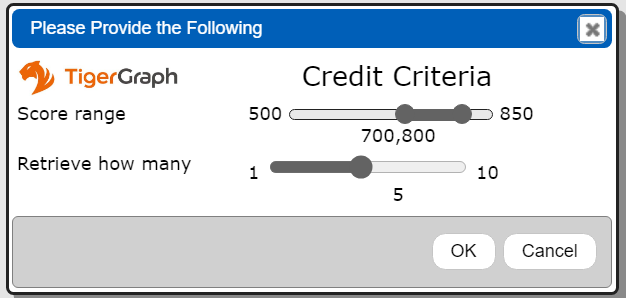
The prompt has 3 elements as shown below.

The minimum and maximum credit score are obtained using a slider. They will be referenced by the data source’s query specification. The template will also be adjusted to display them.
The first element’s primary settings are
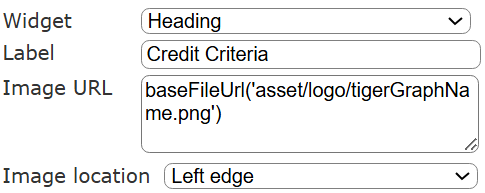
The second element’s primary settings are
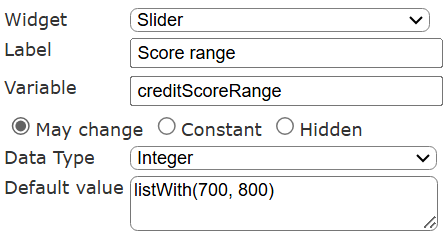
The minimum score value will be in the creditScoreRangeStart and the maximum in creditScoreRangeEnd variable.
The third element’s primary settings are
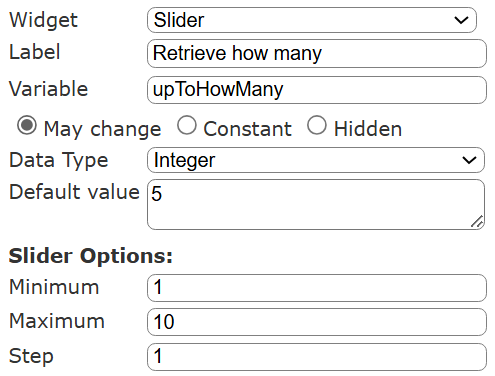
Save this Prompt by clicking
Provide further details and indicate a catalog location.
This prompt can be found at “example/TigerGraph/Prompt for credit score range”.
Using the Prompt
Data Source Updates
A prompt can be referenced by any data source and template. For greater flexibility, we can save the original data source as a new component which references this prompt.
Open a Data Source Designer and then load the previous data source component. A quick way to do this is by using the recents option.
Save this as a new component by clicking
Provide the new component name (Customer360 - Accounts with prompted criteria), its details and indicate a catalog location.
For the new component set the properties by clicking.
The properties dialog is shown.

Navigate to the Prompt tab.

Choose the drop down shown and click the highlighted icon.

Choose the first item.
Close the dialog by clicking.
The properties dialog is updated.

Close the properties dialog by clicking.
Adjust the query specification to use the prompt variables as shown below.
#pragma convertToDate Added_On
SELECT a.Created_On, i.id, i.FirstName, i.LastName, i.CreditScore,
p.type as product_type, p.id as product_id into Result
FROM Account:a -(has_individual>:ii)- Individual:i,
          Account:a -(has_product>:pp)- (CreditCard|Loan):p
WHERE i.CreditScore between @creditScoreRangeStart  and @creditScoreRangeEnd
order by i.id
limit @upToHowMany;
PRINT Result;
The first line above is an optional Qarbine “pragma” indicating to convert the Created_On string values into real Date objects.
Save this Data Source by clicking
This example can be found at “example/TigerGraph/Customer360 - Accounts with prompted criteria”.
Run this data source by clicking
The prompt appears for the criteria.
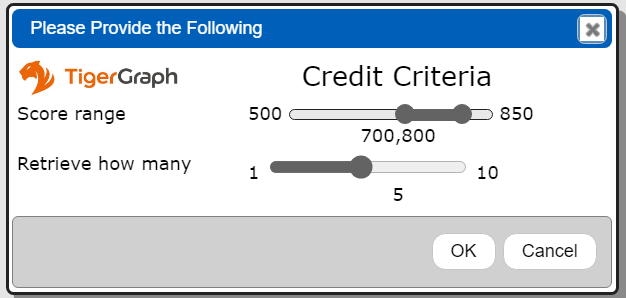
Adjust the criteria as desired.
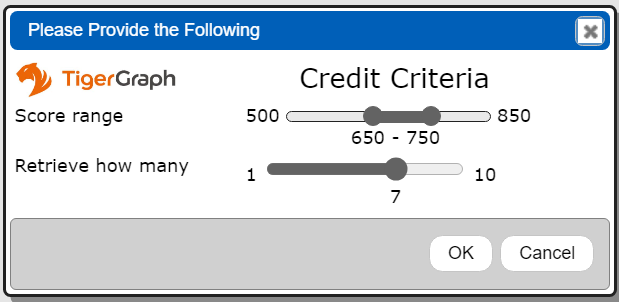
Close the dialog by clicking
The criteria is passed into the query specification which is then run.
Template Updates
The last step is to adjust the original template which uses the hard-coded credit score criteria to use the new, more flexible data source.
Open a Template Designer and then load the previous template component. A quick way to do this is by using the recents option.
Save this as a new component by clicking
Provide the new component name (Customer360 - Accounts with prompted criteria), its details and indicate a catalog location.
For the new component set the properties by clicking.
We are going to change the referenced data source to the new one which uses the prompt and variables. Click on the highlighted icon as shown below.

Choose the data source.
Click
The main data properties are updated.

Close the properties dialog by clicking
In this example the referenced data source references a prompt. Optionally a template may reference a prompt as well and override any data source reference.
The criteria values input from the user obtain from the prompt are going to be shown in the output. This is done by adding 2 report header lines and the cells shown below.

The 2nd line’s cell formula is
concat('Credit scores between ', @creditScoreRangeStart ,
 ' and ', @creditScoreRangeEnd)
Save the updated Template by clicking
Run this template by clicking
The prompt appears for the criteria
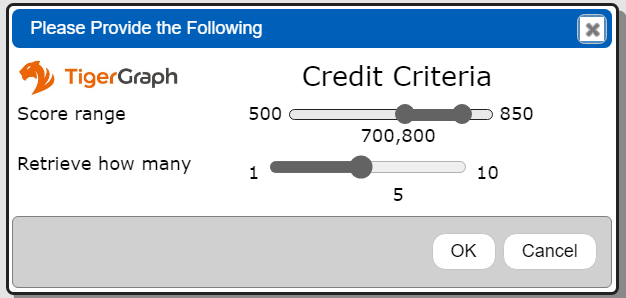
Adjust the criteria as desired.
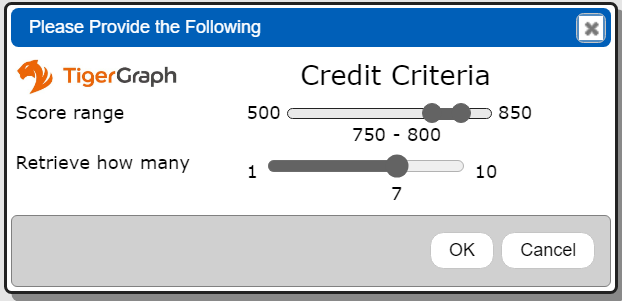
Click
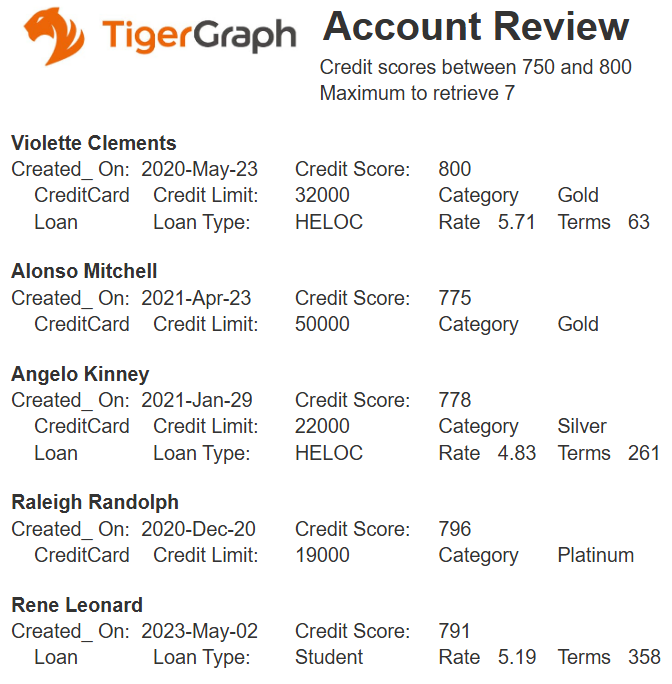
The criteria is passed into the query specification which is then run and used as input to the template. Sample results are shown below.
Next Steps
Querying Your Database
For database specific interaction guides navigate to
References
https://www.tigergraph.comfull-stack-tigergraph-part-2/
https://docs.tigergraph.com/dev/gsql-ref
